
We wanted to develop workflows that used metrics and a standardized process and procedure to evaluate projects moving forward.
senior architect and urban designer at the Boston Planning & Development Agency
Corey Zehngebot
April 23, 2018
3D GIS City Model Guides Development Near Boston Common and Beyond
In the 1980s, long before computer software could generate a digital city, the Boston Planning & Development Agency (BPDA) carved a wooden model of its downtown. The replica helped planners and developers design the city’s future.
Historically, modeling efforts focused on Boston Common, the nation’s oldest city park. Activists in the 1970s successfully rallied against development that could darken the open space. By the early 1990s, Massachusetts passed the Boston Common Shadow Law to limit the amount of time any new building could cast shadows on the beloved park.
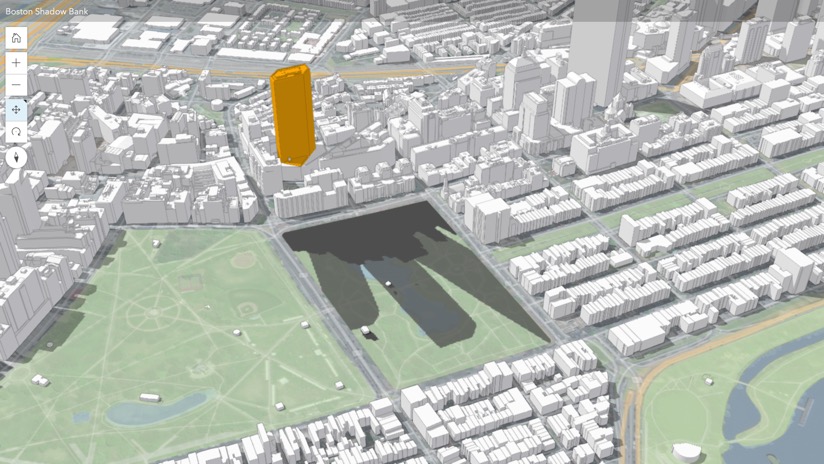
A recent building boom, coupled with the sale of a city-owned parking garage next to the park, prompted BPDA to once again examine shadows cast on Boston Common. This time, instead of a wooden view, BPDA decided to create a digital twin.
“We wanted to make an in-house digital model rather than rely on private developers for analysis,” said Corey Zehngebot, senior architect and urban designer at BPDA. “We are trying to spatially understand environmental impacts using cutting-edge technology with data-driven workflows.”

Twinning the City
While the wooden Boston model provides a compelling tangible twin of the city, its utility ends with what viewers can see. Physical models are limited in scale and not easy to manipulate. They often do not reveal details about building materials or realistic environmental elements such as trees and water. Tangible twins cannot undergo simulation of sun and wind impacts. They are labor-intensive to make and costly to update as the city changes.
“We continue to make additions to the wood model, but we have finite constraints due to the limits of the room that it’s in,” said Carolyn Bennett, geospatial data manager at BPDA. “Having a digital 3D model allows us to capture the entire city and determine real-world impacts to make timely decisions.”
BPDA enlisted the 3D modeling capabilities of geographic information system (GIS) software and the expertise of Esri professional services. Together they created an accurate 3D model of the city complete with tools for analyzing shadows and evaluating the impact of new zoning and development.
We wanted to develop workflows that used metrics and a standardized process and procedure to evaluate projects moving forward.
Shadows Examined
Developers for the parking garage site first presented BPDA with plans in November of 2016. They proposed a 775-foot project, dubbed Winthrop Square Tower, that exceeded Boston Common Shadow Law height restrictions. Debates at City Hall and the Massachusetts State House centered on the project’s height and shadow impact.
Boston Mayor Marty Walsh lobbied to relax the Shadow Law given the proposed development’s financial benefits. Eventually the city reduced shadow constraints, pledging to dedicate developer dollars to much-needed park maintenance and public housing.
While BPDA continues to evaluate plans for Winthrop Square Tower, it does so using Boston’s digital twin. The 3D model gives everyone involved a way to visualize the proposed project, iterate on its design, and analyze impact on downtown Boston.
“Project review is a collaborative effort between partners, a give and take,” Bennett said. “We work with the proponent to achieve the best outcome for both the city and the developer.”
Since the original design, the Winthrop Square Tower height has come down more than 80 feet given the shadow impacts and Federal Aviation Administration guidelines. The revised building meets new shadow requirements and includes a public lobby that developers are calling the Great Hall.
Projects Evaluated
The BPDA’s Development Review Department makes sure projects adhere to Boston’s Zoning Code height, density, and usage requirements. They coordinate the project review process with BPDA planning and urban design staff, city agencies, elected officials, and the community.
While the BPDA does not require digital models from developers, they have maintained a computer-aided design (CAD) model for many years to track development projects. However, BPDA didn’t have the ability to import the CAD models into a smart digital city model with the capabilities to study design scenarios.
“We wanted to develop workflows that used metrics and a standardized process and procedure to evaluate projects moving forward,” Zehngebot said.
The GIS-based 3D twin includes both quantitative and qualitative analysis workflows. The qualitative analysis provides a quick visual to see shadows cast by any new building, including views that BPDA can share with stakeholders. Quantitative assessments provide more in-depth measurements, such as the extent and duration of shadows through the seasons.
“It’s extremely powerful for people to be able to zoom around and look at shadows impacting not just Boston Common and Public Gardens, but any other area of the city,” Bennett said.
The City of Boston opens much of its geographic data for public consumption, and BPDA takes full advantage for its evaluations. Open data includes parcel ownership, zoning districts, historic landmarks, and open space. Analytical data products include projections on the extent of sea-level rise, an important consideration for all coastal cities.
“Integrating the digital 3D model with all of the other data about the city has really been the focus of our efforts,” Zehngebot said.
Future Plans
Boston has experienced three major periods of development in its history. One of the greatest growth periods is now underway. So, Boston’s digital twin comes at a ripe time when the city is re-envisioning itself.
BPDA uses planning and shadow tools to create real-world visualizations for a wide variety of decision-making tasks including planning and development, flood modeling, shadow studies, and line-of-sight evaluation.
Concurrent with growth, Boston officials are contemplating the effects of ridesharing and autonomous vehicles. They are looking into the idea of connecting sensor feeds to maps and models for a real-time awareness of city services. BPDA isn’t directly involved in each of these efforts, but the digital twin they created will provide realistic perspectives.
“We want to make the smart 3D model user friendly and widely available to whomever for whatever,” Zehngebot said. “The sky’s the limit in terms of what we might be able to use it for in the future.”
Find out how 3D GIS provides visualization and analysis capabilities. Explore tailored shadow impact analysis and planning review solutions.

August 30, 2017 |

September 8, 2017 |

January 11, 2018 |